WP_Query Object ( [query] => Array ( [name] => congressional-approval-ratings-over-time [post_type] => resources [resource-type] => data-driven-insights ) [query_vars] => Array ( [name] => congressional-approval-ratings-over-time [post_type] => resources [resource-type] => data-driven-insights [error] => [m] => [p] => 0 [post_parent] => [subpost] => [subpost_id] => [attachment] => [attachment_id] => 0 [pagename] => [page_id] => 0 [second] => [minute] => [hour] => [day] => 0 [monthnum] => 0 [year] => 0 [w] => 0 [category_name] => [tag] => [cat] => [tag_id] => [author] => [author_name] => [feed] => [tb] => [paged] => 0 [meta_key] => [meta_value] => [preview] => [s] => [sentence] => [title] => [fields] => [menu_order] => [embed] => [category__in] => Array ( ) [category__not_in] => Array ( ) [category__and] => Array ( ) [post__in] => Array ( ) [post__not_in] => Array ( ) [post_name__in] => Array ( ) [tag__in] => Array ( ) [tag__not_in] => Array ( ) [tag__and] => Array ( ) [tag_slug__in] => Array ( ) [tag_slug__and] => Array ( ) [post_parent__in] => Array ( ) [post_parent__not_in] => Array ( ) [author__in] => Array ( ) [author__not_in] => Array ( ) [search_columns] => Array ( ) [ignore_sticky_posts] => [suppress_filters] => [cache_results] => 1 [update_post_term_cache] => 1 [update_menu_item_cache] => [lazy_load_term_meta] => 1 [update_post_meta_cache] => 1 [posts_per_page] => 10 [nopaging] => [comments_per_page] => 50 [no_found_rows] => [order] => DESC ) [tax_query] => [meta_query] => WP_Meta_Query Object ( [queries] => Array ( ) [relation] => [meta_table] => [meta_id_column] => [primary_table] => [primary_id_column] => [table_aliases:protected] => Array ( ) [clauses:protected] => Array ( ) [has_or_relation:protected] => ) [date_query] => [queried_object] => WP_Post Object ( [ID] => 6584 [post_author] => 43 [post_date] => 2022-04-06 20:35:36 [post_date_gmt] => 2022-04-06 20:35:36 [post_content] => Political polling often shows that Americans do not agree on much of anything. One common unifier is that Americans overwhelmingly do not approve of Congress. Loathe may be more apt. Just how unfavorable do Americans view Congress? In a 2014 survey reported in The Hill, voters felt more positively about brussels sprouts, head lice, and root canals than Congress. But it hasn’t always been this way. Congressional approval ratings have been polled since 1974 and have greatly varied over time. Congressional approval ratings are determined by monthly surveys of Americans that gauge their satisfaction level with Congress’ performance. Over the past few years, the level of public approval of Congress has generally been low but this number has varied greatly over time since congressional approval polling began in 1974. So how are these approval ratings determined? We did a deep dive into congressional approval ratings to explain the methods in which these ratings are gathered as well as what the current congressional approval rating are and how they compare to historical approval ratings.

How is Congressional Approval Rating Determined?

Polling firms like Morning Consult, Quinnipiac University, and Gallup survey Americans on congressional approval, as well as other public office approval ratings like presidential approval, to take a pulse on political public opinion. These polling firms determine the congressional approval rating by administering surveys. The American Journal on Political Science conducted a study on congressional approval ratings by administering 40 different survey items nearly 300 times to produce quarterly metrics on congressional approval from 1974 through 1993. This is just one example of how congressional approval surveys are administered to Americans. Surveyed Americans are asked questions like, "Overall, do you approve or disapprove of the way that the United States Congress is handling its job?” They are then given a scale of options to rate their approval, neutrality, or disapproval from totally, strongly, or somewhat disapprove, neutral, to somewhat, strongly, or totally approve. In recent years, congressional approval has seen a continuous decline, currently sitting at 20 percent approval when results were last posted in February 2022.

Historical Congressional Approval Ratings

Congressional approval has not always been as low as it is with the 117th Congress. Metrics on congressional approval ratings date all the way back to 1974 when the approval rating started at  30 percent in favor of Congress. It’s important to note that much of public opinion on congressional approval has been shaped by its response (or lack thereof) to major current events. From 1992 to 2001, Congress saw an increase in its approval ratings, growing from 18 percent to 84 percent. Congress received that 84 percent approval rating in October 2001, immediately following its response to the September 11th terror attacks. But as the War on Terror dragged on and the nation endured the Great Recession of 2008, congressional approval dropped from 84 percent in 2001 down to 13 percent in 2010. From 2010 to the present day, congressional approval has hovered between 13 percent and 36 percent monthly, with the highest approval rating of 36 percent in March 2021. Each year’s overall congressional approval rating is taken by averaging the monthly approval and disapproval ratings gathered by pollsters. Each monthly approval rating is influenced by congressional action (or inaction) such as political events, bills passed, and vetoes, during the time a survey is conducted. Yearly Congressional Approval Rating 1974-2021

What Is the Current Congressional Approval Rating?

The current monthly congressional approval rate is 20 percent. From January 2021 through March 2021, Congress saw a rise in approval from 25 percent to 36 percent. This bump in approval reflected American satisfaction with the 117th Congress’ productive start, including passing President Biden’s American Rescue Plan in early March — which distributed another round of COVID-19 economic relief stimulus checks and increased the child tax credit for millions of Americans.[stat align="right" number="20%" text="current congressional approval rating, as of February 2022"] After March 2021, the congressional approval rating continued to decrease, hitting 18 percent in January 2022 and slightly trending upward in February 2022 at 20 percent. Much of congressional approval is directly related to its legislative output level. When Congress passes high-profile bills with widespread public support —like the American Rescue Plan — it influences the public’s opinion on Congress’ effectiveness. Large factors that drive public opinion have much to do with intra-Congress conflict, the passage of major bills, or veto overrides.

Why is the Congressional Approval Rating So Low?

The congressional approval rating is so low because Americans are unhappy with Congress’ performance and tend to have low confidence in major U.S. institutions like Congress. According to a poll from Statista published in July 2021, 47% of Americans surveyed expressed they have very little confidence in Congress as a U.S. institution. Levels of American Confidence in Congress As the country becomes more polarized so too does American opinion on Congress. Much of the in-fighting in 2021 and 2022 in Congress played out in the approval ratings. For example, Congress was unable to pass the John Lewis Voting Rights Act, which Americans on both sides of the aisle broadly supported passing. This is reflected in the decline in approval from the end of 2021 through the beginning of 2022 when Democrats tried and failed to put pressure on moderates to pass the bill. [stat align="left" number="47%" text="percentage of Americans with very little confidence in Congress"] Pollsters like Gallup and Statista also gather other information when surveying congressional approval that captures Americans’ sentiments about Congress including — which officeholders do you feel deserve to be re-elected? How is the Democratic party performing? How is the Republican party performing? Pollsters also conduct public opinion polls on what legislation Congress is proposing and prioritizing. Public opinion polls are important because they highlight the opinion, priorities, and beliefs of the American people. The approval rating across both Democrats and Republicans surveyed was low at 26 and 9 percent, respectively, when polled in January 2022.

Takeaways

47 percent of Americans having little confidence in Congress, yet they continue to re-elect the same people to represent them. While the level of confidence in Congress as an institution is low, Americans have a hard time applying the same level of accountability on their individual representatives for failing to pass legislation that has widespread public support. 90 percent of congressional incumbents seeking reelection win their races. 39 percent of the current members of Congress have served five or more terms in office. [stat align="right" number="90%" text="percentage of congressional incumbents who win re-election"] That being said, the 116th Congress welcomed 111 freshmen, and the 117th Congress brought 60 freshmen to the mix. With a contentious midterm election upon us, keep your eye on which congressional incumbents are re-elected and how the Congressional approval rating will shift when the 118th Congress convenes in January 2023.

How to Incorporate Congressional Approval Ratings into Your Public Affairs Strategy

Every member of Congress has a constituency they represent and answer to. Polling gives members of Congress insight into their performance and decision-making. When preparing for a meeting with a member of Congress, check the current national congressional approval rating along with public opinion polling on your issues. Leverage these poll numbers in your meeting to connect how your issues could impact their performance rating. If your issue is widely supported by Americans, bring numbers showing the high percentage of Americans supporting your issue and contrast that with the low approval rating make the connection between your issue and American satisfaction with congressional performance. [post_title] => Congressional Approval Rating Breakdown [post_excerpt] => Congressional approval has been on the decline since 2010, but why is this? Learn more about congressional approval and its historical trends. [post_status] => publish [comment_status] => closed [ping_status] => closed [post_password] => [post_name] => congressional-approval-ratings-over-time [to_ping] => [pinged] => [post_modified] => 2022-04-11 17:27:29 [post_modified_gmt] => 2022-04-11 17:27:29 [post_content_filtered] => [post_parent] => 0 [guid] => https://www.quorum.us/?post_type=resources&p=6584 [menu_order] => 0 [post_type] => resources [post_mime_type] => [comment_count] => 0 [filter] => raw ) [queried_object_id] => 6584 [request] => SELECT wp_posts.* FROM wp_posts WHERE 1=1 AND wp_posts.post_name = 'congressional-approval-ratings-over-time' AND wp_posts.post_type = 'resources' ORDER BY wp_posts.post_date DESC [posts] => Array ( [0] => WP_Post Object ( [ID] => 6584 [post_author] => 43 [post_date] => 2022-04-06 20:35:36 [post_date_gmt] => 2022-04-06 20:35:36 [post_content] => Political polling often shows that Americans do not agree on much of anything. One common unifier is that Americans overwhelmingly do not approve of Congress. Loathe may be more apt. Just how unfavorable do Americans view Congress? In a 2014 survey reported in The Hill, voters felt more positively about brussels sprouts, head lice, and root canals than Congress. But it hasn’t always been this way. Congressional approval ratings have been polled since 1974 and have greatly varied over time. Congressional approval ratings are determined by monthly surveys of Americans that gauge their satisfaction level with Congress’ performance. Over the past few years, the level of public approval of Congress has generally been low but this number has varied greatly over time since congressional approval polling began in 1974. So how are these approval ratings determined? We did a deep dive into congressional approval ratings to explain the methods in which these ratings are gathered as well as what the current congressional approval rating are and how they compare to historical approval ratings.

How is Congressional Approval Rating Determined?

Polling firms like Morning Consult, Quinnipiac University, and Gallup survey Americans on congressional approval, as well as other public office approval ratings like presidential approval, to take a pulse on political public opinion. These polling firms determine the congressional approval rating by administering surveys. The American Journal on Political Science conducted a study on congressional approval ratings by administering 40 different survey items nearly 300 times to produce quarterly metrics on congressional approval from 1974 through 1993. This is just one example of how congressional approval surveys are administered to Americans. Surveyed Americans are asked questions like, "Overall, do you approve or disapprove of the way that the United States Congress is handling its job?” They are then given a scale of options to rate their approval, neutrality, or disapproval from totally, strongly, or somewhat disapprove, neutral, to somewhat, strongly, or totally approve. In recent years, congressional approval has seen a continuous decline, currently sitting at 20 percent approval when results were last posted in February 2022.

Historical Congressional Approval Ratings

Congressional approval has not always been as low as it is with the 117th Congress. Metrics on congressional approval ratings date all the way back to 1974 when the approval rating started at  30 percent in favor of Congress. It’s important to note that much of public opinion on congressional approval has been shaped by its response (or lack thereof) to major current events. From 1992 to 2001, Congress saw an increase in its approval ratings, growing from 18 percent to 84 percent. Congress received that 84 percent approval rating in October 2001, immediately following its response to the September 11th terror attacks. But as the War on Terror dragged on and the nation endured the Great Recession of 2008, congressional approval dropped from 84 percent in 2001 down to 13 percent in 2010. From 2010 to the present day, congressional approval has hovered between 13 percent and 36 percent monthly, with the highest approval rating of 36 percent in March 2021. Each year’s overall congressional approval rating is taken by averaging the monthly approval and disapproval ratings gathered by pollsters. Each monthly approval rating is influenced by congressional action (or inaction) such as political events, bills passed, and vetoes, during the time a survey is conducted. Yearly Congressional Approval Rating 1974-2021

What Is the Current Congressional Approval Rating?

The current monthly congressional approval rate is 20 percent. From January 2021 through March 2021, Congress saw a rise in approval from 25 percent to 36 percent. This bump in approval reflected American satisfaction with the 117th Congress’ productive start, including passing President Biden’s American Rescue Plan in early March — which distributed another round of COVID-19 economic relief stimulus checks and increased the child tax credit for millions of Americans.[stat align="right" number="20%" text="current congressional approval rating, as of February 2022"] After March 2021, the congressional approval rating continued to decrease, hitting 18 percent in January 2022 and slightly trending upward in February 2022 at 20 percent. Much of congressional approval is directly related to its legislative output level. When Congress passes high-profile bills with widespread public support —like the American Rescue Plan — it influences the public’s opinion on Congress’ effectiveness. Large factors that drive public opinion have much to do with intra-Congress conflict, the passage of major bills, or veto overrides.

Why is the Congressional Approval Rating So Low?

The congressional approval rating is so low because Americans are unhappy with Congress’ performance and tend to have low confidence in major U.S. institutions like Congress. According to a poll from Statista published in July 2021, 47% of Americans surveyed expressed they have very little confidence in Congress as a U.S. institution. Levels of American Confidence in Congress As the country becomes more polarized so too does American opinion on Congress. Much of the in-fighting in 2021 and 2022 in Congress played out in the approval ratings. For example, Congress was unable to pass the John Lewis Voting Rights Act, which Americans on both sides of the aisle broadly supported passing. This is reflected in the decline in approval from the end of 2021 through the beginning of 2022 when Democrats tried and failed to put pressure on moderates to pass the bill. [stat align="left" number="47%" text="percentage of Americans with very little confidence in Congress"] Pollsters like Gallup and Statista also gather other information when surveying congressional approval that captures Americans’ sentiments about Congress including — which officeholders do you feel deserve to be re-elected? How is the Democratic party performing? How is the Republican party performing? Pollsters also conduct public opinion polls on what legislation Congress is proposing and prioritizing. Public opinion polls are important because they highlight the opinion, priorities, and beliefs of the American people. The approval rating across both Democrats and Republicans surveyed was low at 26 and 9 percent, respectively, when polled in January 2022.

Takeaways

47 percent of Americans having little confidence in Congress, yet they continue to re-elect the same people to represent them. While the level of confidence in Congress as an institution is low, Americans have a hard time applying the same level of accountability on their individual representatives for failing to pass legislation that has widespread public support. 90 percent of congressional incumbents seeking reelection win their races. 39 percent of the current members of Congress have served five or more terms in office. [stat align="right" number="90%" text="percentage of congressional incumbents who win re-election"] That being said, the 116th Congress welcomed 111 freshmen, and the 117th Congress brought 60 freshmen to the mix. With a contentious midterm election upon us, keep your eye on which congressional incumbents are re-elected and how the Congressional approval rating will shift when the 118th Congress convenes in January 2023.

How to Incorporate Congressional Approval Ratings into Your Public Affairs Strategy

Every member of Congress has a constituency they represent and answer to. Polling gives members of Congress insight into their performance and decision-making. When preparing for a meeting with a member of Congress, check the current national congressional approval rating along with public opinion polling on your issues. Leverage these poll numbers in your meeting to connect how your issues could impact their performance rating. If your issue is widely supported by Americans, bring numbers showing the high percentage of Americans supporting your issue and contrast that with the low approval rating make the connection between your issue and American satisfaction with congressional performance. [post_title] => Congressional Approval Rating Breakdown [post_excerpt] => Congressional approval has been on the decline since 2010, but why is this? Learn more about congressional approval and its historical trends. [post_status] => publish [comment_status] => closed [ping_status] => closed [post_password] => [post_name] => congressional-approval-ratings-over-time [to_ping] => [pinged] => [post_modified] => 2022-04-11 17:27:29 [post_modified_gmt] => 2022-04-11 17:27:29 [post_content_filtered] => [post_parent] => 0 [guid] => https://www.quorum.us/?post_type=resources&p=6584 [menu_order] => 0 [post_type] => resources [post_mime_type] => [comment_count] => 0 [filter] => raw ) ) [post_count] => 1 [current_post] => -1 [before_loop] => 1 [in_the_loop] => [post] => WP_Post Object ( [ID] => 6584 [post_author] => 43 [post_date] => 2022-04-06 20:35:36 [post_date_gmt] => 2022-04-06 20:35:36 [post_content] => Political polling often shows that Americans do not agree on much of anything. One common unifier is that Americans overwhelmingly do not approve of Congress. Loathe may be more apt. Just how unfavorable do Americans view Congress? In a 2014 survey reported in The Hill, voters felt more positively about brussels sprouts, head lice, and root canals than Congress. But it hasn’t always been this way. Congressional approval ratings have been polled since 1974 and have greatly varied over time. Congressional approval ratings are determined by monthly surveys of Americans that gauge their satisfaction level with Congress’ performance. Over the past few years, the level of public approval of Congress has generally been low but this number has varied greatly over time since congressional approval polling began in 1974. So how are these approval ratings determined? We did a deep dive into congressional approval ratings to explain the methods in which these ratings are gathered as well as what the current congressional approval rating are and how they compare to historical approval ratings.

How is Congressional Approval Rating Determined?

Polling firms like Morning Consult, Quinnipiac University, and Gallup survey Americans on congressional approval, as well as other public office approval ratings like presidential approval, to take a pulse on political public opinion. These polling firms determine the congressional approval rating by administering surveys. The American Journal on Political Science conducted a study on congressional approval ratings by administering 40 different survey items nearly 300 times to produce quarterly metrics on congressional approval from 1974 through 1993. This is just one example of how congressional approval surveys are administered to Americans. Surveyed Americans are asked questions like, "Overall, do you approve or disapprove of the way that the United States Congress is handling its job?” They are then given a scale of options to rate their approval, neutrality, or disapproval from totally, strongly, or somewhat disapprove, neutral, to somewhat, strongly, or totally approve. In recent years, congressional approval has seen a continuous decline, currently sitting at 20 percent approval when results were last posted in February 2022.

Historical Congressional Approval Ratings

Congressional approval has not always been as low as it is with the 117th Congress. Metrics on congressional approval ratings date all the way back to 1974 when the approval rating started at  30 percent in favor of Congress. It’s important to note that much of public opinion on congressional approval has been shaped by its response (or lack thereof) to major current events. From 1992 to 2001, Congress saw an increase in its approval ratings, growing from 18 percent to 84 percent. Congress received that 84 percent approval rating in October 2001, immediately following its response to the September 11th terror attacks. But as the War on Terror dragged on and the nation endured the Great Recession of 2008, congressional approval dropped from 84 percent in 2001 down to 13 percent in 2010. From 2010 to the present day, congressional approval has hovered between 13 percent and 36 percent monthly, with the highest approval rating of 36 percent in March 2021. Each year’s overall congressional approval rating is taken by averaging the monthly approval and disapproval ratings gathered by pollsters. Each monthly approval rating is influenced by congressional action (or inaction) such as political events, bills passed, and vetoes, during the time a survey is conducted. Yearly Congressional Approval Rating 1974-2021

What Is the Current Congressional Approval Rating?

The current monthly congressional approval rate is 20 percent. From January 2021 through March 2021, Congress saw a rise in approval from 25 percent to 36 percent. This bump in approval reflected American satisfaction with the 117th Congress’ productive start, including passing President Biden’s American Rescue Plan in early March — which distributed another round of COVID-19 economic relief stimulus checks and increased the child tax credit for millions of Americans.[stat align="right" number="20%" text="current congressional approval rating, as of February 2022"] After March 2021, the congressional approval rating continued to decrease, hitting 18 percent in January 2022 and slightly trending upward in February 2022 at 20 percent. Much of congressional approval is directly related to its legislative output level. When Congress passes high-profile bills with widespread public support —like the American Rescue Plan — it influences the public’s opinion on Congress’ effectiveness. Large factors that drive public opinion have much to do with intra-Congress conflict, the passage of major bills, or veto overrides.

Why is the Congressional Approval Rating So Low?

The congressional approval rating is so low because Americans are unhappy with Congress’ performance and tend to have low confidence in major U.S. institutions like Congress. According to a poll from Statista published in July 2021, 47% of Americans surveyed expressed they have very little confidence in Congress as a U.S. institution. Levels of American Confidence in Congress As the country becomes more polarized so too does American opinion on Congress. Much of the in-fighting in 2021 and 2022 in Congress played out in the approval ratings. For example, Congress was unable to pass the John Lewis Voting Rights Act, which Americans on both sides of the aisle broadly supported passing. This is reflected in the decline in approval from the end of 2021 through the beginning of 2022 when Democrats tried and failed to put pressure on moderates to pass the bill. [stat align="left" number="47%" text="percentage of Americans with very little confidence in Congress"] Pollsters like Gallup and Statista also gather other information when surveying congressional approval that captures Americans’ sentiments about Congress including — which officeholders do you feel deserve to be re-elected? How is the Democratic party performing? How is the Republican party performing? Pollsters also conduct public opinion polls on what legislation Congress is proposing and prioritizing. Public opinion polls are important because they highlight the opinion, priorities, and beliefs of the American people. The approval rating across both Democrats and Republicans surveyed was low at 26 and 9 percent, respectively, when polled in January 2022.

Takeaways

47 percent of Americans having little confidence in Congress, yet they continue to re-elect the same people to represent them. While the level of confidence in Congress as an institution is low, Americans have a hard time applying the same level of accountability on their individual representatives for failing to pass legislation that has widespread public support. 90 percent of congressional incumbents seeking reelection win their races. 39 percent of the current members of Congress have served five or more terms in office. [stat align="right" number="90%" text="percentage of congressional incumbents who win re-election"] That being said, the 116th Congress welcomed 111 freshmen, and the 117th Congress brought 60 freshmen to the mix. With a contentious midterm election upon us, keep your eye on which congressional incumbents are re-elected and how the Congressional approval rating will shift when the 118th Congress convenes in January 2023.

How to Incorporate Congressional Approval Ratings into Your Public Affairs Strategy

Every member of Congress has a constituency they represent and answer to. Polling gives members of Congress insight into their performance and decision-making. When preparing for a meeting with a member of Congress, check the current national congressional approval rating along with public opinion polling on your issues. Leverage these poll numbers in your meeting to connect how your issues could impact their performance rating. If your issue is widely supported by Americans, bring numbers showing the high percentage of Americans supporting your issue and contrast that with the low approval rating make the connection between your issue and American satisfaction with congressional performance. [post_title] => Congressional Approval Rating Breakdown [post_excerpt] => Congressional approval has been on the decline since 2010, but why is this? Learn more about congressional approval and its historical trends. [post_status] => publish [comment_status] => closed [ping_status] => closed [post_password] => [post_name] => congressional-approval-ratings-over-time [to_ping] => [pinged] => [post_modified] => 2022-04-11 17:27:29 [post_modified_gmt] => 2022-04-11 17:27:29 [post_content_filtered] => [post_parent] => 0 [guid] => https://www.quorum.us/?post_type=resources&p=6584 [menu_order] => 0 [post_type] => resources [post_mime_type] => [comment_count] => 0 [filter] => raw ) [comment_count] => 0 [current_comment] => -1 [found_posts] => 1 [max_num_pages] => 0 [max_num_comment_pages] => 0 [is_single] => 1 [is_preview] => [is_page] => [is_archive] => [is_date] => [is_year] => [is_month] => [is_day] => [is_time] => [is_author] => [is_category] => [is_tag] => [is_tax] => [is_search] => [is_feed] => [is_comment_feed] => [is_trackback] => [is_home] => [is_privacy_policy] => [is_404] => [is_embed] => [is_paged] => [is_admin] => [is_attachment] => [is_singular] => 1 [is_robots] => [is_favicon] => [is_posts_page] => [is_post_type_archive] => [query_vars_hash:WP_Query:private] => 7ae242ab9283bfd51b592199c2aefe79 [query_vars_changed:WP_Query:private] => [thumbnails_cached] => [allow_query_attachment_by_filename:protected] => [stopwords:WP_Query:private] => [compat_fields:WP_Query:private] => Array ( [0] => query_vars_hash [1] => query_vars_changed ) [compat_methods:WP_Query:private] => Array ( [0] => init_query_flags [1] => parse_tax_query ) )
!!! 6584
Data Driven Insights

Congressional Approval Rating Breakdown

Congressional Approval Rating Breakdown

Political polling often shows that Americans do not agree on much of anything. One common unifier is that Americans overwhelmingly do not approve of Congress. Loathe may be more apt. Just how unfavorable do Americans view Congress? In a 2014 survey reported in The Hill, voters felt more positively about brussels sprouts, head lice, and root canals than Congress. But it hasn’t always been this way. Congressional approval ratings have been polled since 1974 and have greatly varied over time.

Congressional approval ratings are determined by monthly surveys of Americans that gauge their satisfaction level with Congress’ performance. Over the past few years, the level of public approval of Congress has generally been low but this number has varied greatly over time since congressional approval polling began in 1974.

So how are these approval ratings determined? We did a deep dive into congressional approval ratings to explain the methods in which these ratings are gathered as well as what the current congressional approval rating are and how they compare to historical approval ratings.

How is Congressional Approval Rating Determined?

Polling firms like Morning Consult, Quinnipiac University, and Gallup survey Americans on congressional approval, as well as other public office approval ratings like presidential approval, to take a pulse on political public opinion. These polling firms determine the congressional approval rating by administering surveys. The American Journal on Political Science conducted a study on congressional approval ratings by administering 40 different survey items nearly 300 times to produce quarterly metrics on congressional approval from 1974 through 1993. This is just one example of how congressional approval surveys are administered to Americans.

Surveyed Americans are asked questions like, “Overall, do you approve or disapprove of the way that the United States Congress is handling its job?” They are then given a scale of options to rate their approval, neutrality, or disapproval from totally, strongly, or somewhat disapprove, neutral, to somewhat, strongly, or totally approve. In recent years, congressional approval has seen a continuous decline, currently sitting at 20 percent approval when results were last posted in February 2022.

Historical Congressional Approval Ratings

Congressional approval has not always been as low as it is with the 117th Congress. Metrics on congressional approval ratings date all the way back to 1974 when the approval rating started at  30 percent in favor of Congress. It’s important to note that much of public opinion on congressional approval has been shaped by its response (or lack thereof) to major current events.

From 1992 to 2001, Congress saw an increase in its approval ratings, growing from 18 percent to 84 percent. Congress received that 84 percent approval rating in October 2001, immediately following its response to the September 11th terror attacks. But as the War on Terror dragged on and the nation endured the Great Recession of 2008, congressional approval dropped from 84 percent in 2001 down to 13 percent in 2010. From 2010 to the present day, congressional approval has hovered between 13 percent and 36 percent monthly, with the highest approval rating of 36 percent in March 2021. Each year’s overall congressional approval rating is taken by averaging the monthly approval and disapproval ratings gathered by pollsters. Each monthly approval rating is influenced by congressional action (or inaction) such as political events, bills passed, and vetoes, during the time a survey is conducted.
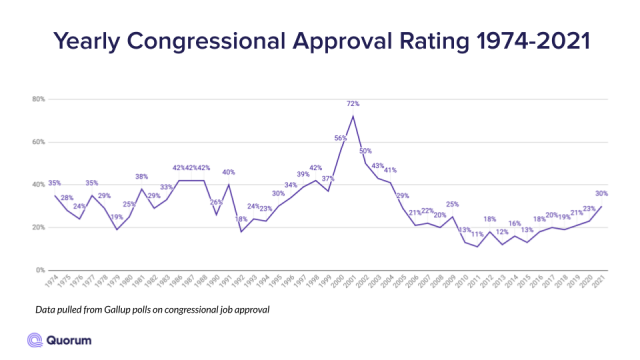
Yearly Congressional Approval Rating 1974-2021

What Is the Current Congressional Approval Rating?

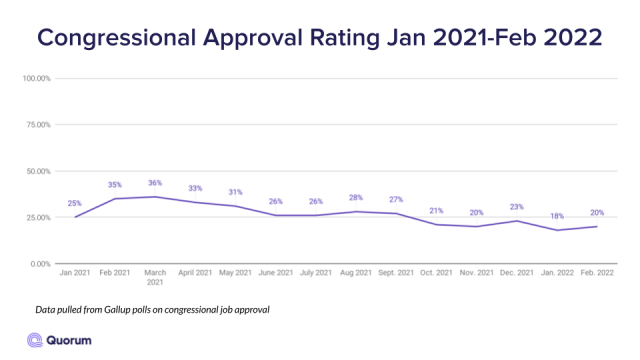
The current monthly congressional approval rate is 20 percent. From January 2021 through March 2021, Congress saw a rise in approval from 25 percent to 36 percent. This bump in approval reflected American satisfaction with the 117th Congress’ productive start, including passing President Biden’s American Rescue Plan in early March — which distributed another round of COVID-19 economic relief stimulus checks and increased the child tax credit for millions of Americans.

20%
current congressional approval rating, as of February 2022
After March 2021, the congressional approval rating continued to decrease, hitting 18 percent in January 2022 and slightly trending upward in February 2022 at 20 percent.

Much of congressional approval is directly related to its legislative output level. When Congress passes high-profile bills with widespread public support —like the American Rescue Plan — it influences the public’s opinion on Congress’ effectiveness. Large factors that drive public opinion have much to do with intra-Congress conflict, the passage of major bills, or veto overrides.
Why is the Congressional Approval Rating So Low?

The congressional approval rating is so low because Americans are unhappy with Congress’ performance and tend to have low confidence in major U.S. institutions like Congress. According to a poll from Statista published in July 2021, 47% of Americans surveyed expressed they have very little confidence in Congress as a U.S. institution.
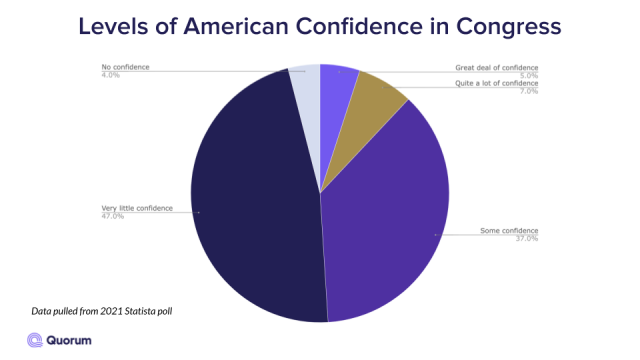
Levels of American Confidence in Congress

As the country becomes more polarized so too does American opinion on Congress. Much of the in-fighting in 2021 and 2022 in Congress played out in the approval ratings. For example, Congress was unable to pass the John Lewis Voting Rights Act, which Americans on both sides of the aisle broadly supported passing. This is reflected in the decline in approval from the end of 2021 through the beginning of 2022 when Democrats tried and failed to put pressure on moderates to pass the bill.

47%
percentage of Americans with very little confidence in Congress

Pollsters like Gallup and Statista also gather other information when surveying congressional approval that captures Americans’ sentiments about Congress including — which officeholders do you feel deserve to be re-elected? How is the Democratic party performing? How is the Republican party performing? Pollsters also conduct public opinion polls on what legislation Congress is proposing and prioritizing. Public opinion polls are important because they highlight the opinion, priorities, and beliefs of the American people. The approval rating across both Democrats and Republicans surveyed was low at 26 and 9 percent, respectively, when polled in January 2022.

Takeaways

47 percent of Americans having little confidence in Congress, yet they continue to re-elect the same people to represent them. While the level of confidence in Congress as an institution is low, Americans have a hard time applying the same level of accountability on their individual representatives for failing to pass legislation that has widespread public support. 90 percent of congressional incumbents seeking reelection win their races. 39 percent of the current members of Congress have served five or more terms in office.

90%
percentage of congressional incumbents who win re-election

That being said, the 116th Congress welcomed 111 freshmen, and the 117th Congress brought 60 freshmen to the mix. With a contentious midterm election upon us, keep your eye on which congressional incumbents are re-elected and how the Congressional approval rating will shift when the 118th Congress convenes in January 2023.

How to Incorporate Congressional Approval Ratings into Your Public Affairs Strategy

Every member of Congress has a constituency they represent and answer to. Polling gives members of Congress insight into their performance and decision-making. When preparing for a meeting with a member of Congress, check the current national congressional approval rating along with public opinion polling on your issues. Leverage these poll numbers in your meeting to connect how your issues could impact their performance rating. If your issue is widely supported by Americans, bring numbers showing the high percentage of Americans supporting your issue and contrast that with the low approval rating make the connection between your issue and American satisfaction with congressional performance.
Quorum makes it easier for your team to effectively understand what legislation, regulations, and conversations are happening on Capitol Hill.